Aerosol optical depth comparison between GAW-PFR and AERONET-Cimel radiometers from long-term (2005ā€“2015) 1ā€‰min synchronous measurements

CE318-T IzaƱa

Aerosol optical depth comparison between GAW-PFR and AERONET-Cimel radiometers from long-term (2005ā€“2015) 1ā€‰min synchronous measurements

August 9, 2019

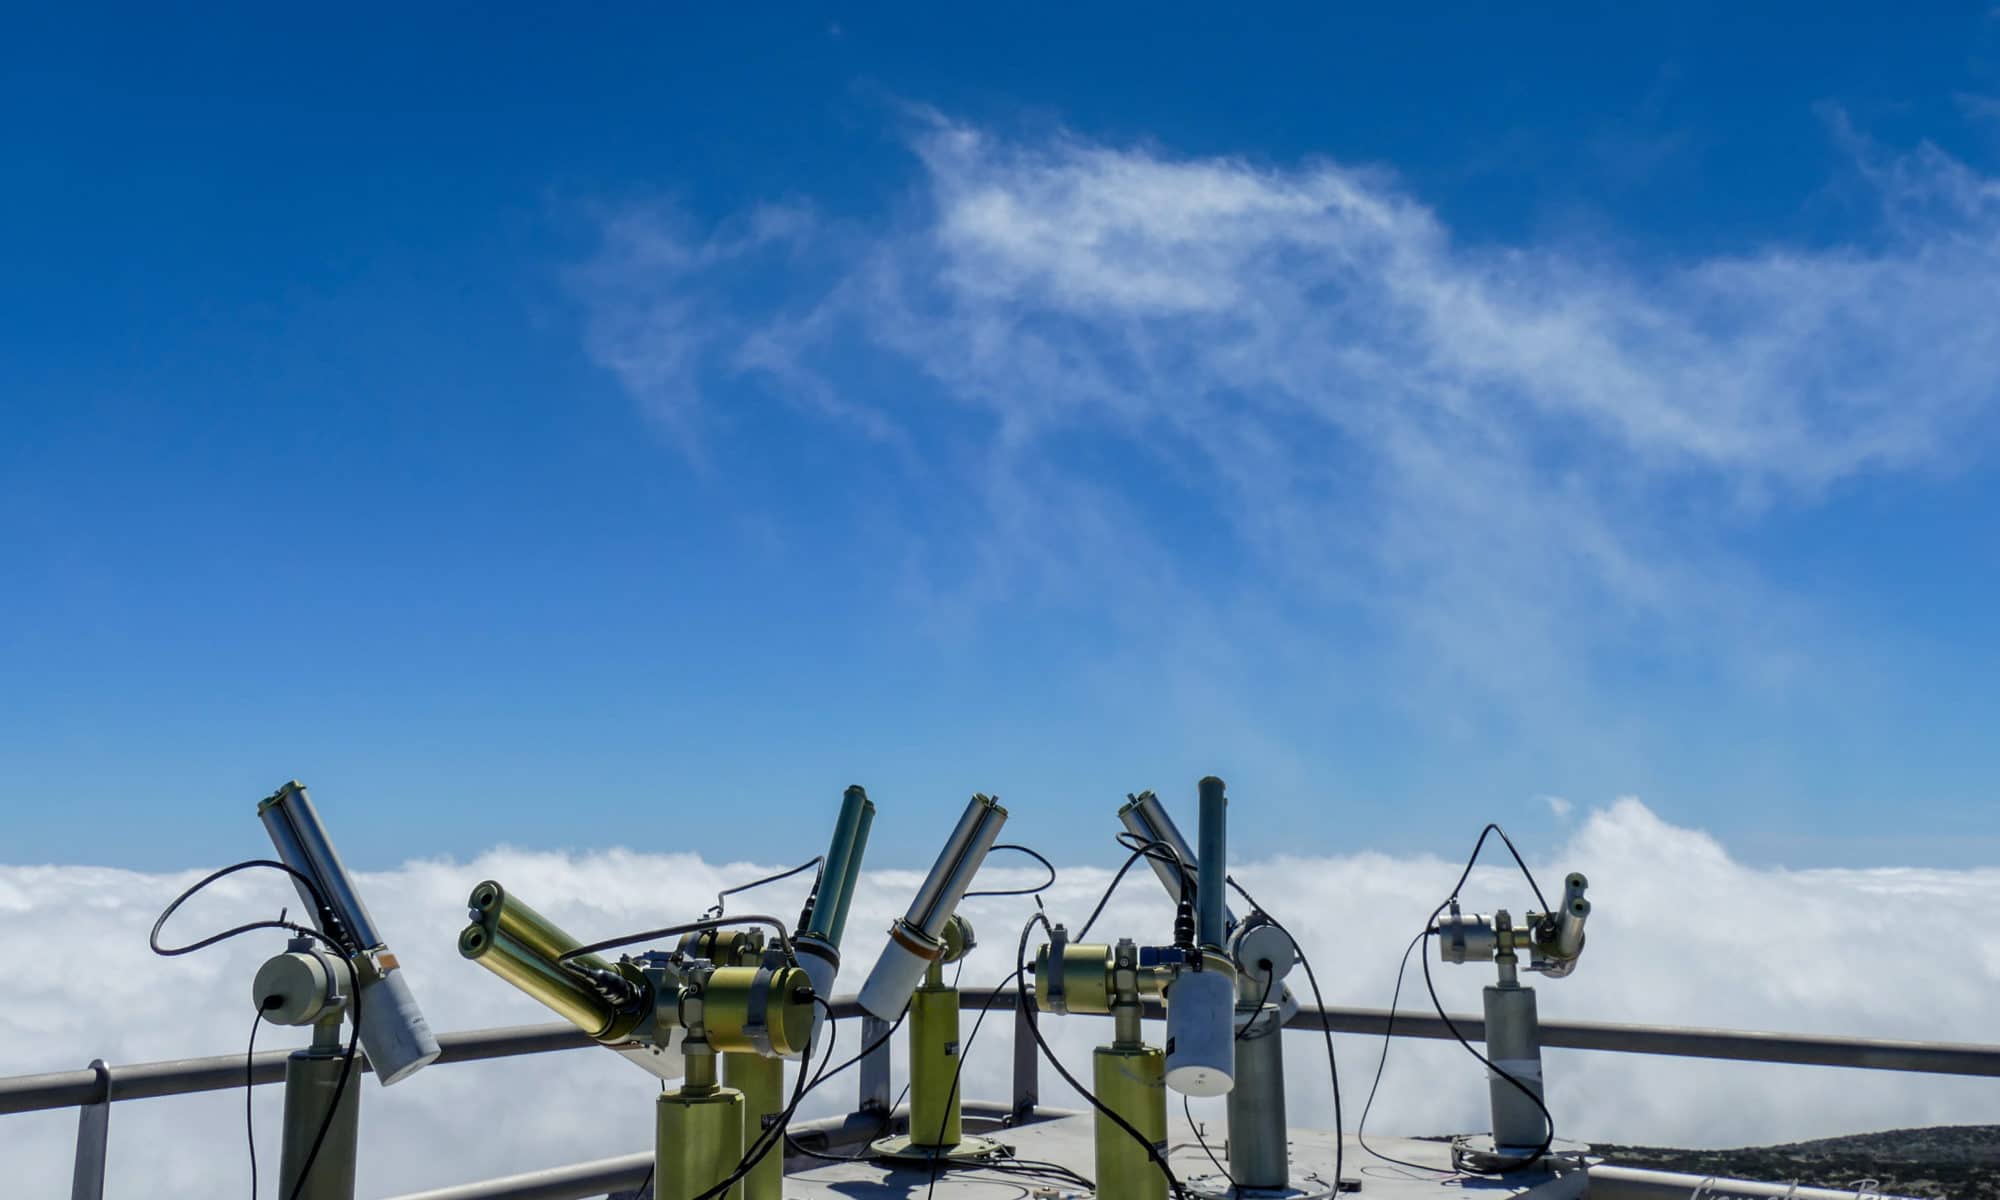
A comprehensive comparison of more than 70ā€‰000Ā synchronous 1ā€‰min aerosol optical depth (AOD) data from three Global Atmosphere Watch precision-filter radiometers (GAW-PFR), traceable to the World AOD reference, and 15 Aerosol Robotic Network Cimel radiometers (AERONET-Cimel), calibrated individually with the Langley plot technique, was performed for four common or ā€œnearā€ wavelengths, 380, 440, 500 and 870ā€‰nm, in the period 2005ā€“2015.

The goal of this study is to assess whether, despite the marked technical differences between both networks (AERONET, GAW-PFR) and the number of instruments used, their long-term AOD data are comparable and consistent.

The percentage of data meeting the World Meteorological Organization (WMO) traceability requirements (95ā€‰% of the AOD differences of an instrument compared to the WMO standards lie within specific limits) isĀ >92ā€‰% at 380ā€‰nm,Ā >95ā€‰% at 440ā€‰nm and 500ā€‰nm, and 98ā€‰% at 870ā€‰nm, with the results being quite similar for both AERONET versionĀ 2 (V2) and versionĀ 3 (V3). For the data outside these limits, the contribution of calibration and differences in the calculation of the optical depth contribution due to Rayleigh scattering andĀ O3Ā andĀ NO2Ā absorption have a negligible impact. For AODĀ >0.1, a small but non-negligible percentage (āˆ¼1.9ā€‰%) of the AOD data outside the WMO limits at 380ā€‰nm can be partly assigned to the impact of dust aerosol forward scattering on the AOD calculation due to the different field of view of the instruments. Due to this effect the GAW-PFR provides AOD values, which areĀ āˆ¼3ā€‰% lower at 380ā€‰nm andĀ āˆ¼2ā€‰% lower at 500ā€‰nm compared with AERONET-Cimel. The comparison of the ƅngstrƶm exponent (AE) shows that under non-pristine conditions (AODā€‰>0.03Ā and AEā€‰<1) the AE differences remainĀ <0.1. This long-term comparison shows an excellent traceability of AERONET-Cimel AOD with the World AOD reference at 440, 500 and 870ā€‰nm channels and a fairly good agreement at 380ā€‰nm, although AOD should be improved in the UV range.

Citation: Cuevas, E., Romero-Campos, P. M., Kouremeti, N., Kazadzis, S., RƤisƤnen, P., GarcĆ­a, R. D., Barreto, A., Guirado-Fuentes, C., Ramos, R., Toledano, C., Almansa, F., and Grƶbner, J.: Aerosol optical depth comparison between GAW-PFR and AERONET-Cimel radiometers from long-term (2005ā€“2015) 1ā€‰min synchronous measurements, Atmos. Meas. Tech., 12, 4309ā€“4337, https://doi.org/10.5194/amt-12-4309-2019, 2019.

READ THE ARTICLE

IAOOS

IAOOS – Ice Atmosphere Arctic Ocean Observing System

FEBRUARY 2011 – DECEMBER 2019

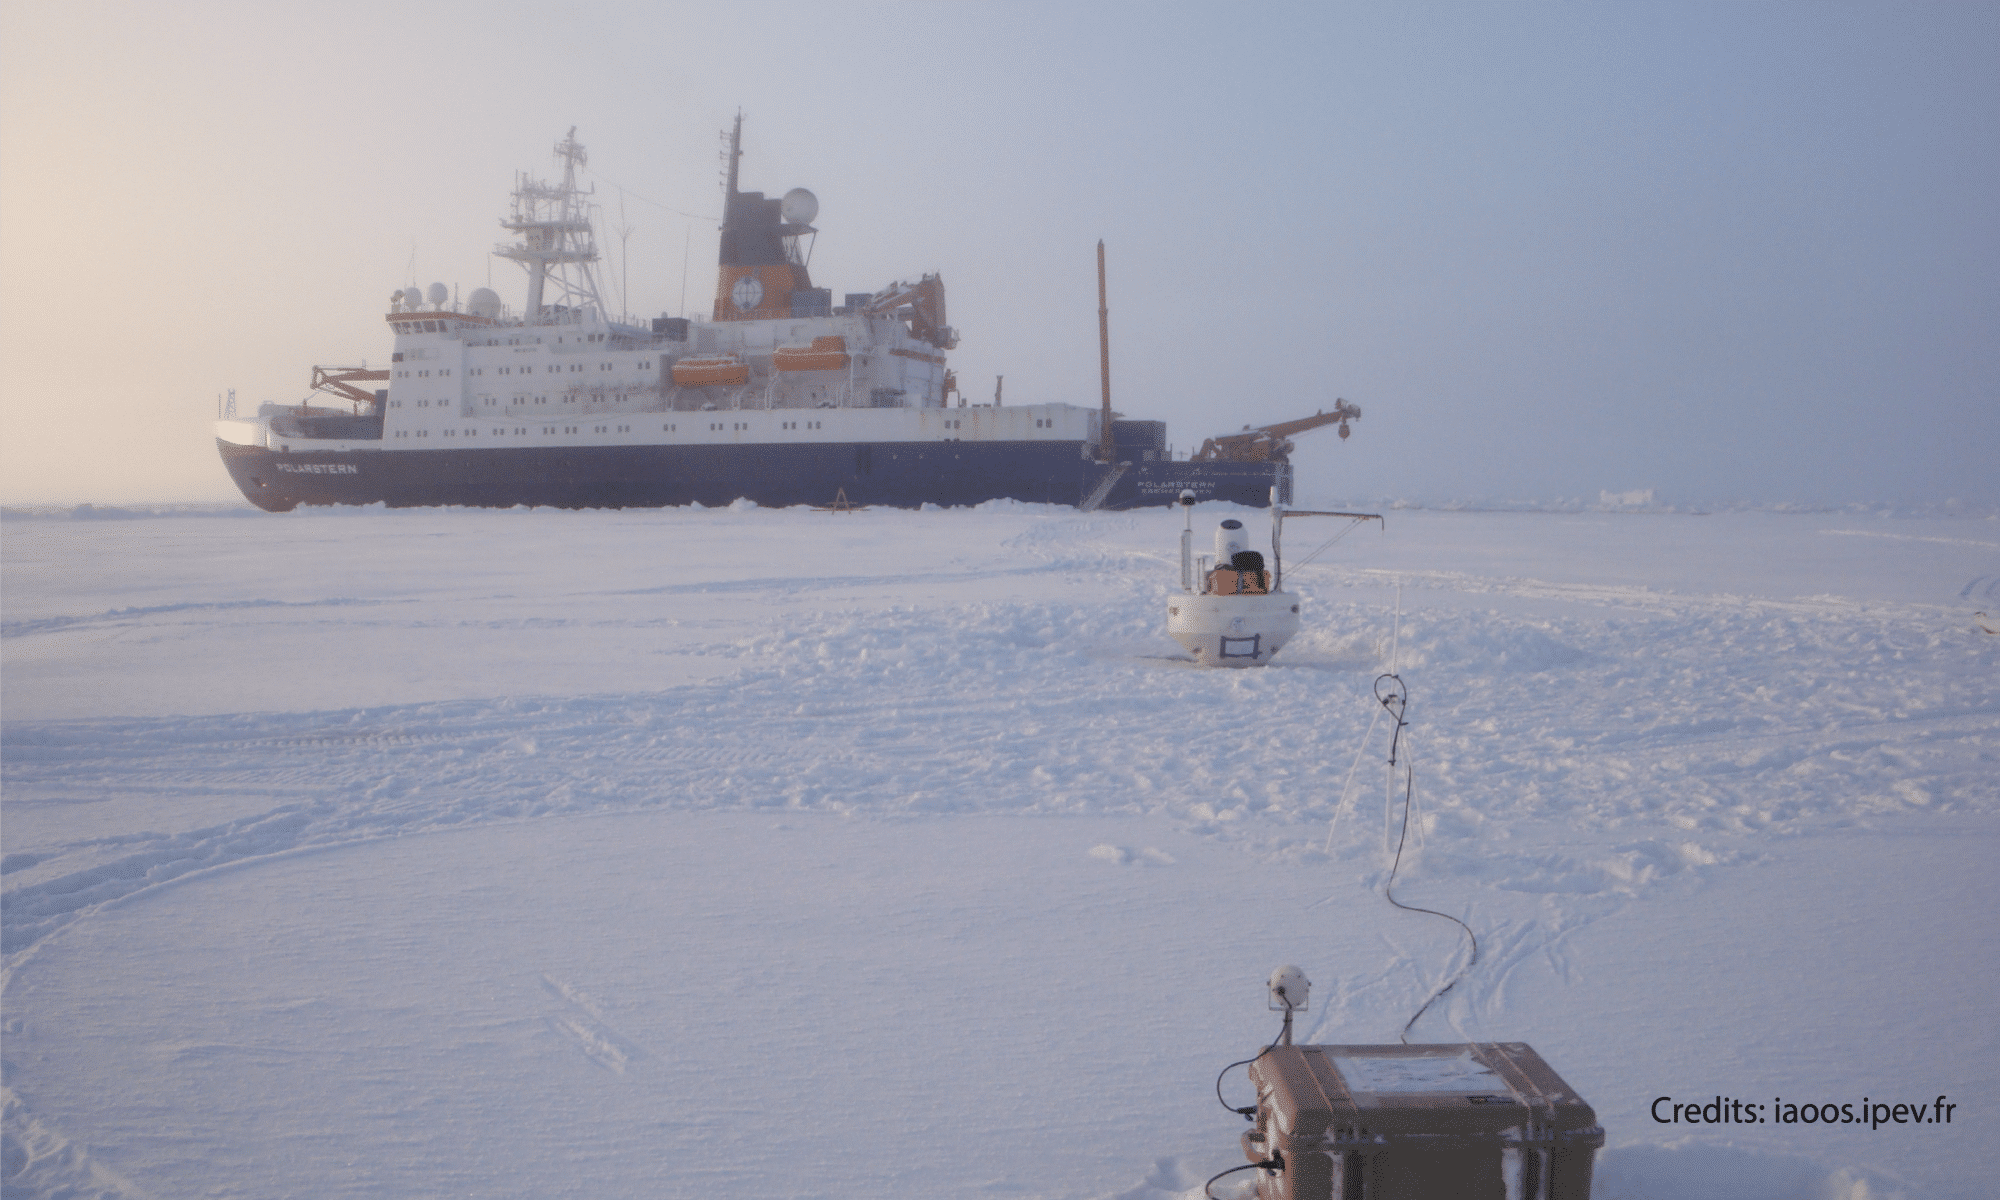
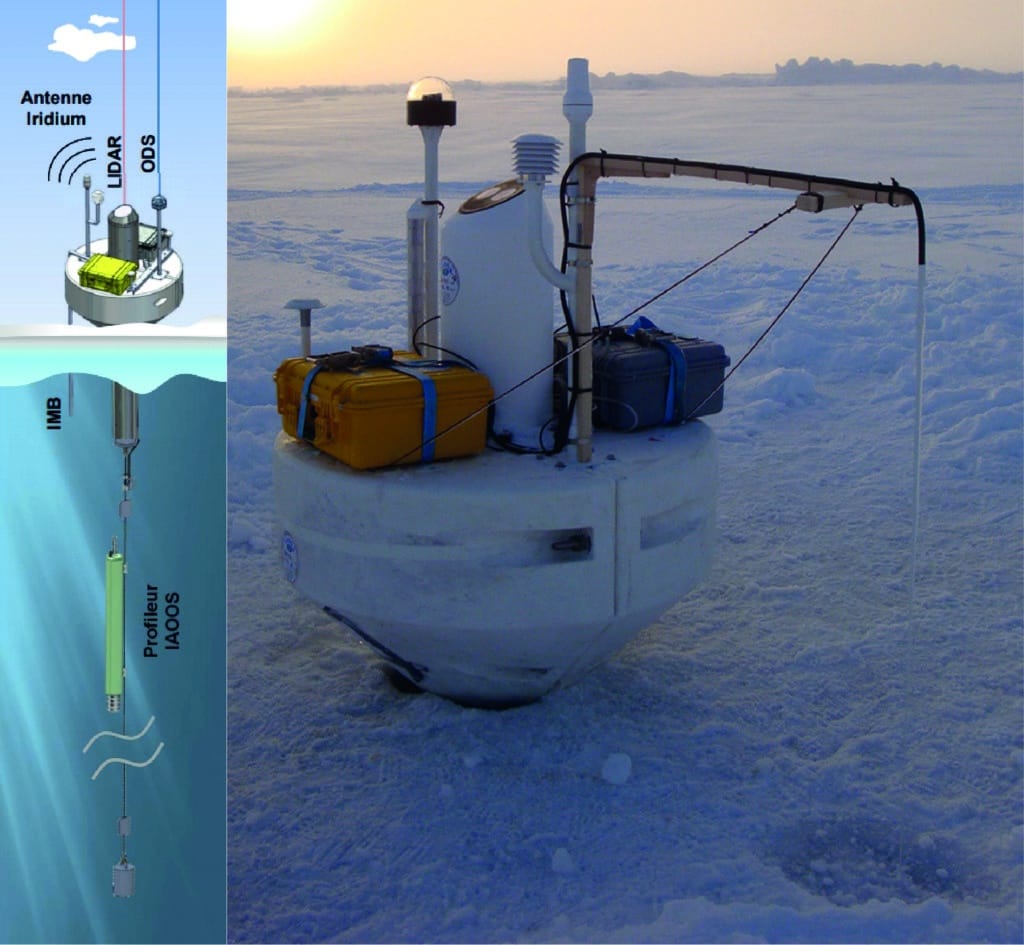
The IAOOS Project’s objective is to develop and maintain an automated observation network of ice-tethered platforms across the Arctic Ocean which will simultaneously and independently transmit via satellite, in near real time, the state of the ocean, sea ice and the lower atmosphere.

The project uses a CIMEL microlidar to monitor the atmosphere (T, conso, f optical window).

IAOOS project

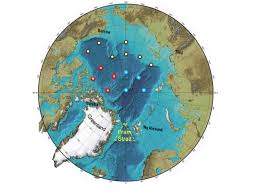
The IAOOS equipment is based on 15 autonomous platforms working at any time in the Arctic Ocean, for a period of 7 years. Every platform, made up of 3 elements ocean / atmosphere / sea ice, drifts with the sea ice, the surface winds and the oceanic currents. They are designed to stay at the sea-ice surface and float on the surface of the ocean, with an autonomy of 2 years.

The IAOOS project plans the deployment of 6 platforms per year, following the plan of deployment of the first 15 platforms. Two periods of deployments are planned every year: in spring and in autumn.

Project
Observing, understanding and quantifying climate changes in the Arctic. IAOOS is specifically concerned with the potential for a significantly reduced sea ice cover, and the impacts this might have on the environment and on human activities, both regionally and globally.

Objectives

  • Deploy and maintain an integrated observing system providing simultaneous observations of the ocean, ice and lower atmosphere in real time in the Arctic
  • Complementary to satellite observations
  • Better understanding of interactions
  • Feed operational models
  • Improve predicting capabilities

Equipment on the IAOOS Platforms

  • CTD vertical profilers from 0 to 1000 m depth (conductivity, temperature, depth)
  • Ice Mass Balance (IMB)
  • Temperature and pressure sensors
  • CIMEL microlidars: T, conso, f optical window for atmosphere monitoring
  • Optical depth sensors (ODS)

Partners

IAOOS platform

References

  • Vincent Mariage, Jacques Pelon, FreĢdeĢric Blouzon, SteĢphane Victori. IAOOS microlidar development and firsts results obtained during 2014 and 2015 arctic drifts . EPJ Web of Conferences, EDP Sciences, 2016, The 27th International Laser Radar Conference (IRLC 27), 119, 02005 (4 p.)(https://hal-insu.archives-ouvertes.fr/insu-01175931)
  • Vincent Mariage, Jacques Pelon, FreĢdeĢric Blouzon, SteĢphane Victori, Nicolas Geyskens, Nadir Amarouche, Christine Drezen, Antoine Guillot, Michel Calzas, Magali Garracio, Nicolas Wegmuller, Nathalie SenneĢchael, and Christine Provost, “IAOOS microlidar-on-buoy development and first atmospheric observations obtained during 2014 and 2015 arctic drifts,” Opt. Express 25, A73-A84 (2017) (https://doi.org/10.1364/OE.25.000A73)
  • Vincent Mariage. DeĢveloppement et mise en oeuvre de LiDAR embarqueĢs sur boueĢes deĢrivantes pour l’eĢtude des proprieĢteĢs des aeĢrosols et des nuages en Arctique et des forƧages radiatifs induits. Physique AtmospheĢrique et OceĢanique [physics.ao-ph]. UniversiteĢ Pierre et Marie Curie – Paris VI, 2015. FranƧais. āŸØNNT : 2015PA066580āŸ©

Sunbelt Spectra comparison with Standard ASTM G173: the Chilean case

Sunbelt Spectra comparison with Standard ASTM G173: the Chilean case

December, 2017

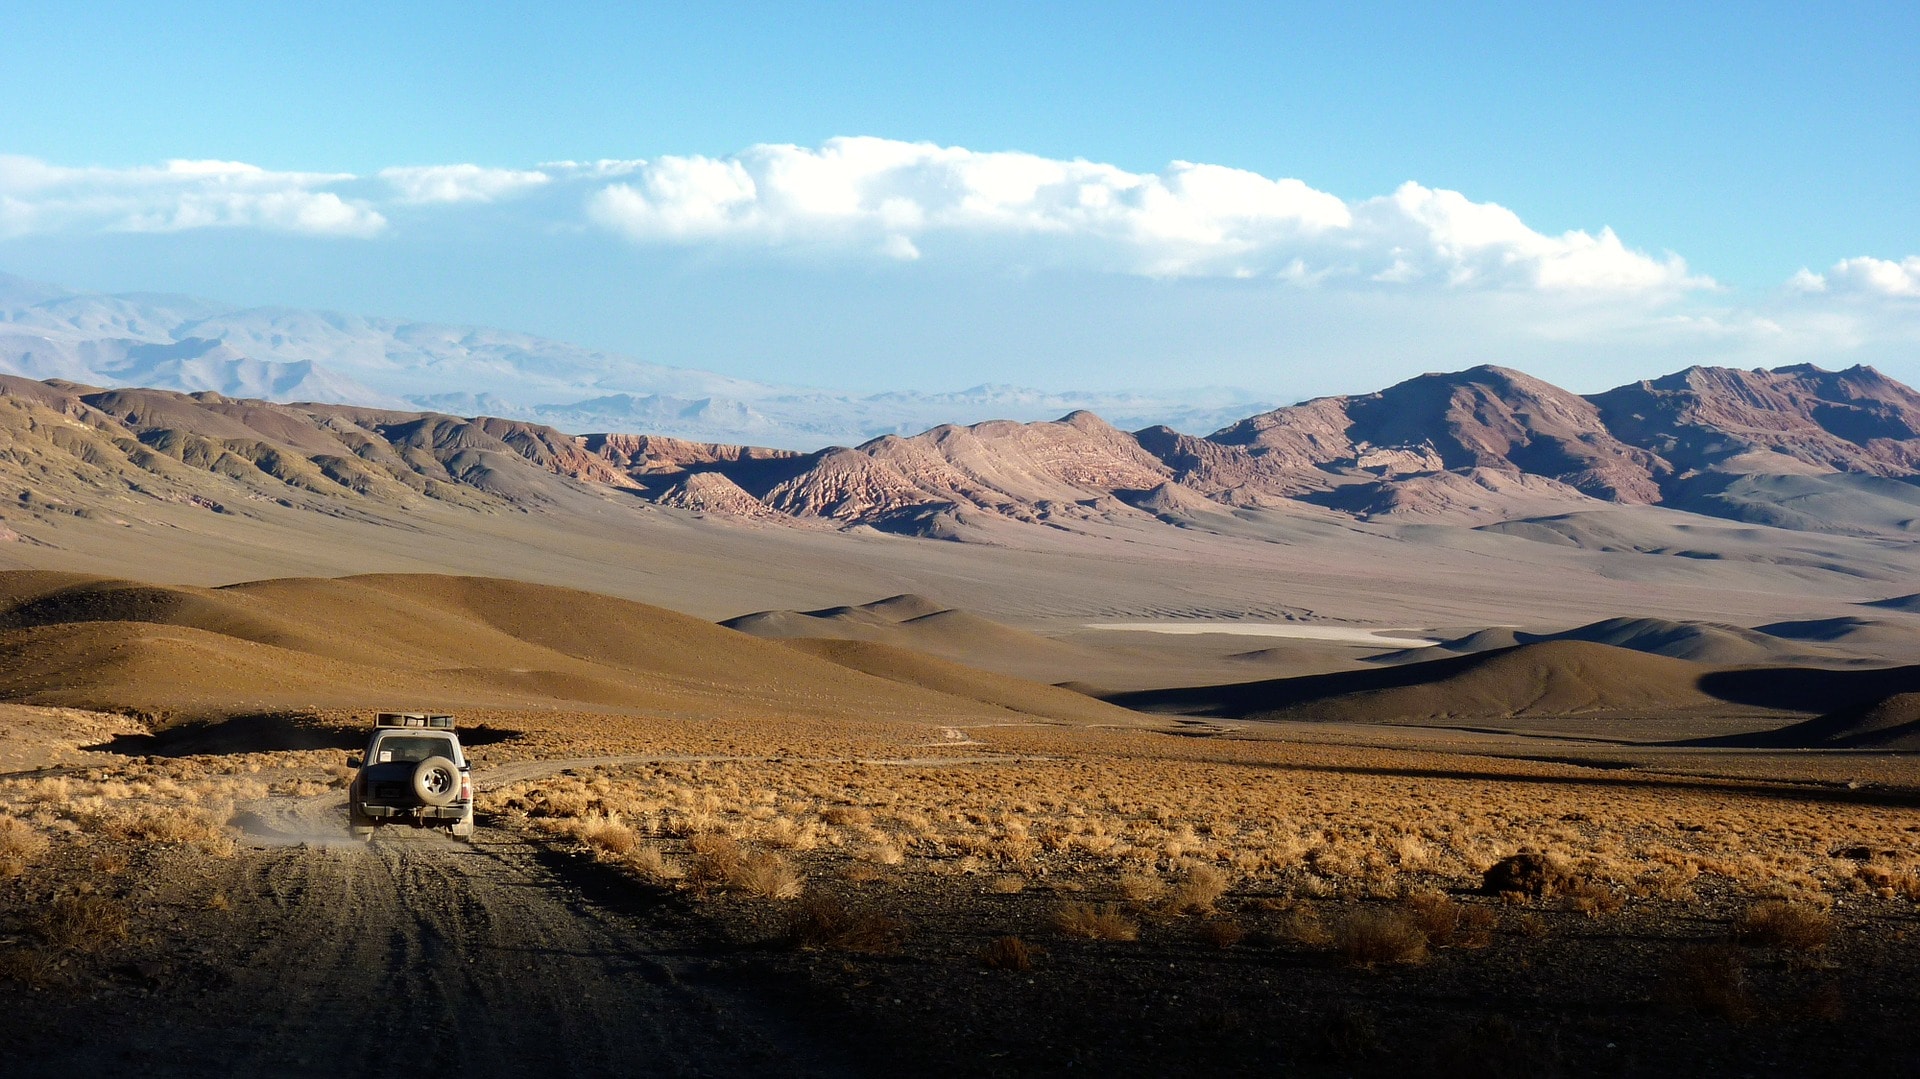
Two spectra of solar direct normal irradiance (including circumsolar) are estimated based on spatio-temporal averages of the relevant atmospheric parameters extracted from two different databases: MODIS satellite sensor retrievals and AERONET sun photometer network. The satellite database is used to calculate an average spectrum for the area of the Atacama Desert. The AERONET database is used for two purposes: (i) to apply bias-removal linear methods to correct the MODIS parameters over Atacama, and (ii) to calculate an average local spectrum for the Paranal station. The SMARTS radiative transfer model is used to obtain the three spectra developed in this study. Both the Atacama and Paranal spectra are compared against each other and also to the world reference, ASTM G173. In one of the cases, significant differences are found for short wavelengths. In order to quantify the relative importance of these spectral differences, the propagation of errors due to the use of each spectrum is evaluated for CSP applications over the Atacama Desert, considering twelve different scenarios involving the reflectance, transmittance or absorptance of various materials.

Citation: Marzo, Aitor & Polo, Jesus & Wilbert, Stefan & Gueymard, Chris & Jessen, Wilko & Ferrada, Pablo & Alonso-Montesinos, JoaquĆ­n & BallestrĆ­n, JesĆŗs. (2017). Sunbelt Spectra comparison with Standard ASTM G173: the Chilean case. AIP Conference Proceedings. 2033. 10.1063/1.5067195.

READ THE ARTICLE

Image source: Pixabay

FIREX – AQ Mission

FIREX – AQ Mission

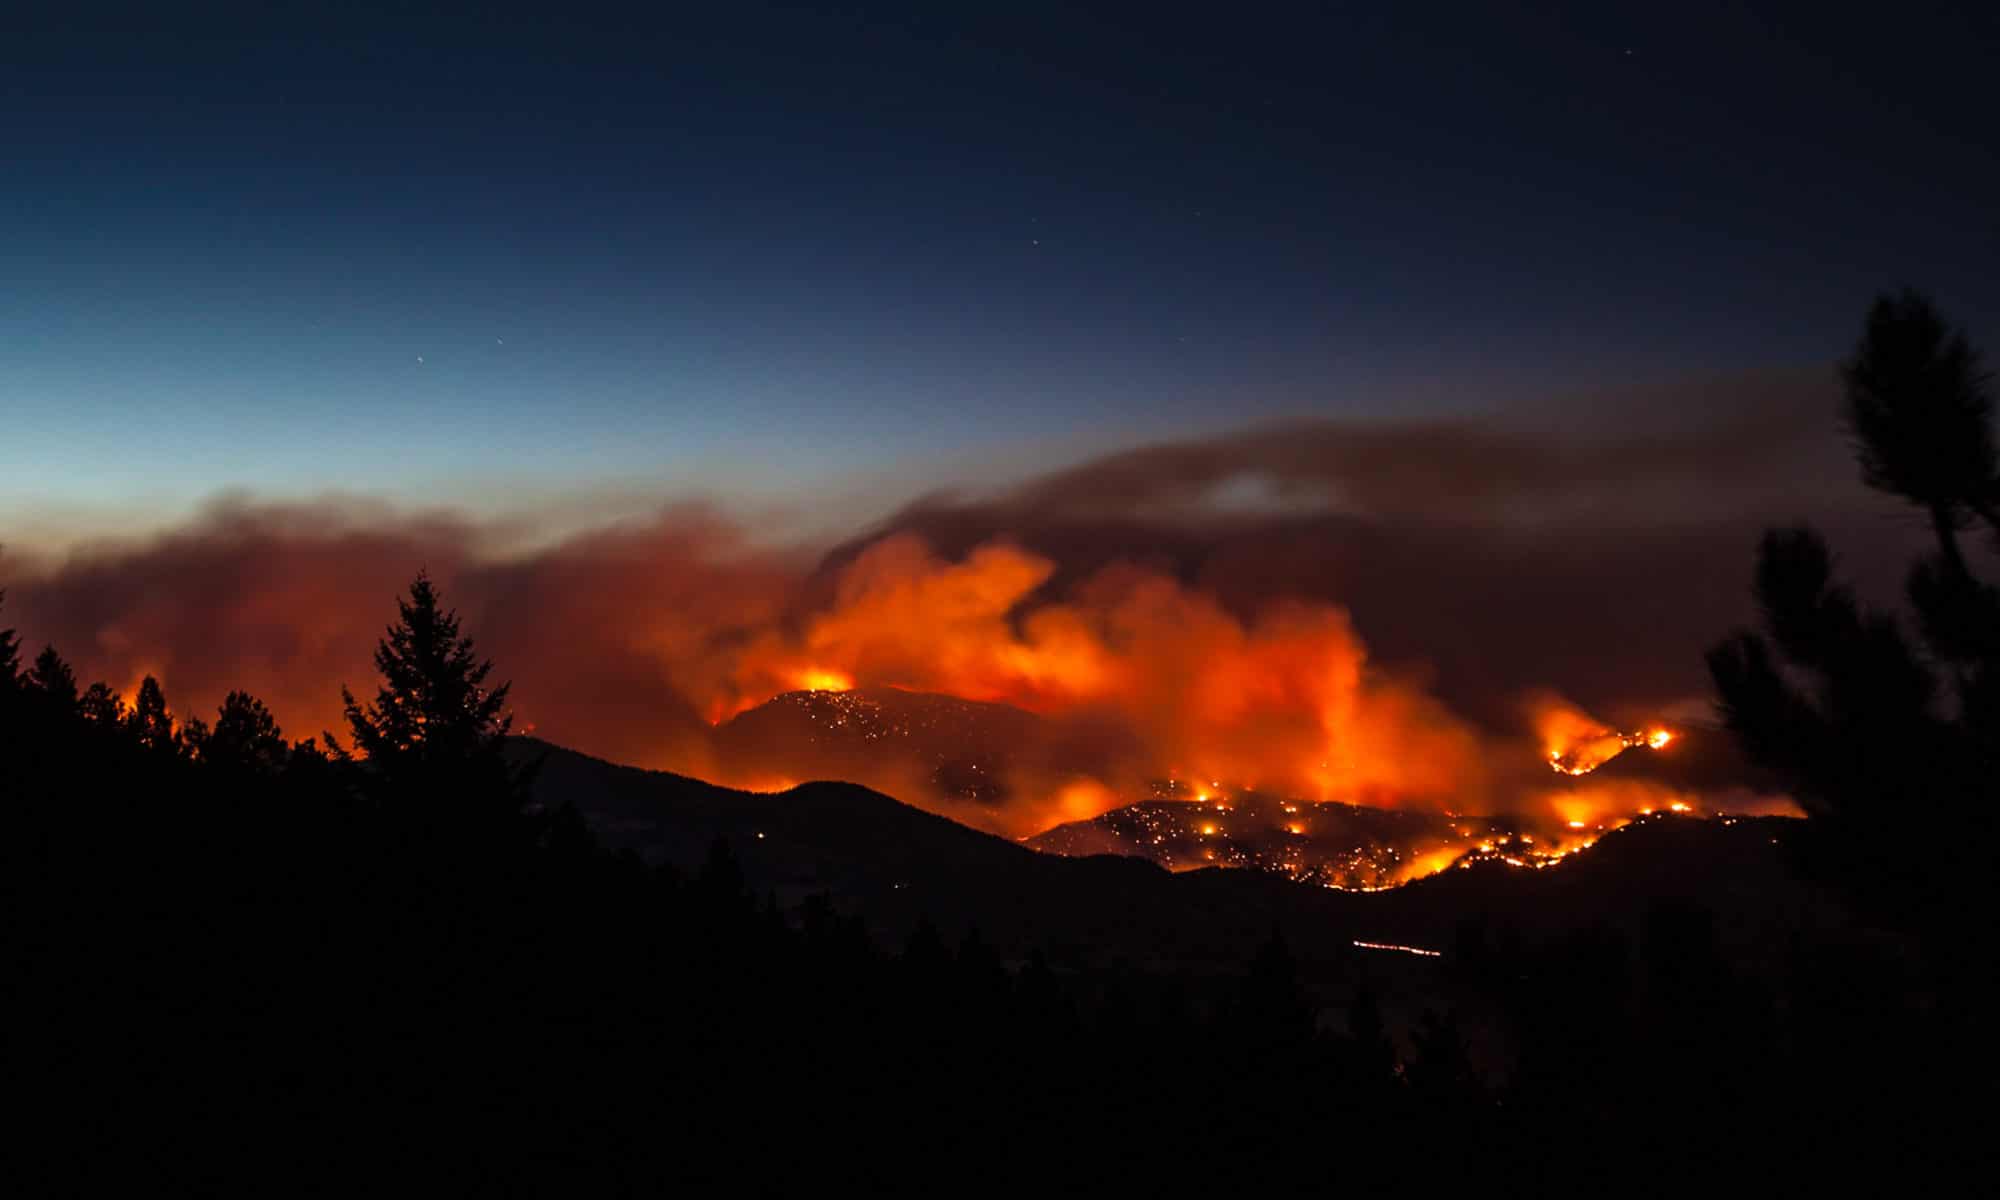
Approximately half of fire emissions in the US are from Northwestern wildfires and half are from prescribed fires that burn mostly in the Southeast US. Wildfires burn slightly more fuel and therefore have overall larger emissions, but prescribed fires dominate the area burned and the number of fires. FIREX-AQ will investigate both wild and prescribed fires. Wildfires generally result in exposures with larger pollution concentrations over larger areas, and cause both local and regional air quality impacts. Their emissions are often transported thousands of miles and can impact large regions of the US at a time. Prescribed fires are usually smaller and less intense than most wildfires but occur more frequently and throughout the whole year. They are usually ignited during periods that minimize population expose and air quality impacts, but can cause regional backgrounds to increase, are generally in closer proximity to populations, and are responsible for a large fraction of the US PM2.5 emissions.

This summer, NOAA and NASA are teaming up on a massive research campaign called FIREX-AQ that will use satellites, aircraft, drones, mobile and ground stations to study smoke from wildfires and agricultural crop fires across the U.S. 

Objective: To improve understanding of wildfire and agricultural fire impacts on air quality, weather, and climate.

Cimel provides a CE376 micro-LiDAR as well as its network of CE318-T photometers through AERONET. These solutions will provide detailed measurements of aerosols emitted from wildfires and agricultural fires to address science topics and evaluate impacts on local and regional air quality, and how satellite data can be used to estimate emissions more accurately.

The Primary Mission Partners are:

Photo: P. Cullis, NOAA / CIRES

COBIACC campaign

COBIACC campaign

Is the rural atmosphere better than elsewhere?

For the entire month of July in CaillouĆ«l-CreĢpigny (France), scientists from the University of Lille and ATMO Hauts-de-France will analyze particles in the air and their impact on health in rural areas.

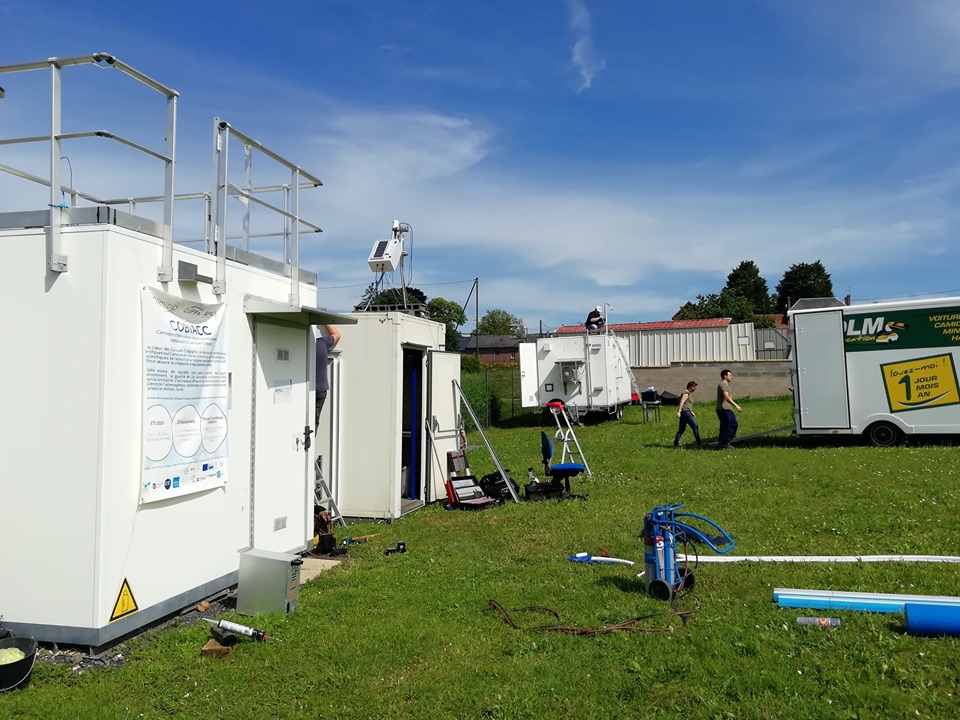
Since 28 June, more than twenty air pollution measuring devices deployed over 100 mĀ² in the commune of CaillouĆ«l-CreĢpigny (02) may answer this question.

Objectives: To understand the formation and the composition of particles and their precursors in the air in a rural environment during the summer period.

The sensors collect dust from the countryside and nearby dust from forests, roads, buildings and industries in the distance.

The facility consists of four containers installed on 100 mĀ² in the village square of CaillouĆ«l-CreĢpigny. They accommodate twenty-two observation instruments including our Cimel Sun Sky Lunar CE318-T photometer as well as our CE376 micro-LiDAR. These instruments, unique in France, measure the impact of climate change on air quality, biodiversity and health. Thirty researchers take turns night and day to study the chemical modifications of particles during periods of high heat.

This campaign was named COBIACC for Campagne d’OBservation Intensive des AeĢrosols et preĢcurseurs Ć  CaillouĆ«l-CreĢpigny. It is the result of a partnership between Labex CaPPA, a laboratory of excellence in Lille, CPER Climibio, an environmental project involving 16 laboratories in the Hauts-de-France and Atmo Hauts-de-France, the regional air quality observatory.

Laboratories involved:

NASA AERONET

NASA AERONET

Aerosols, these tiny particles of the lower atmosphere, are one important component of atmosphere affecting climate (radiative effects, water cycle) and air quality.

For characterizing and monitoring aerosols, water wapor and clouds, LOA and Cimel, in collaboration with NASA’s GSFC, developed the robotic solar photometer for the AERONET network in the early 1990s. The meeting between CNRS and NASA researchers and the industrial company Cimel led to the definition of an automatic, robust, autonomous solar photometer that transmits its data by radio, providing AOD and particle size in real time. In 1998, the French component (PHOTONS) was awarded the INSU Observation Service label.

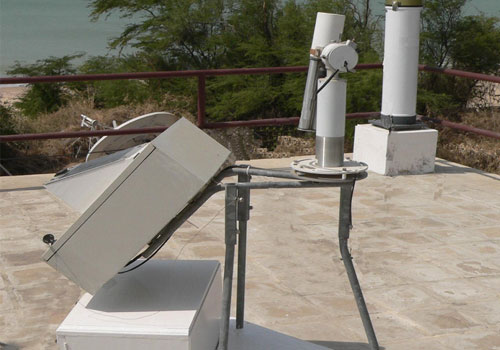
Cimel is NASA ā€“ AERONETā€™s exclusive supplier of automatic Sun Sky Lunar photometers (CIMEL CE318-T) operating in near real time and providing aerosol optical and columnar microphysical properties.

A 10-year characterization of the Saharan Air Layer lidar ratio in the subtropical North Atlantic

A 10-year characterization of the Saharan Air Layer lidar ratio in the subtropical North Atlantic

May 10, 2019

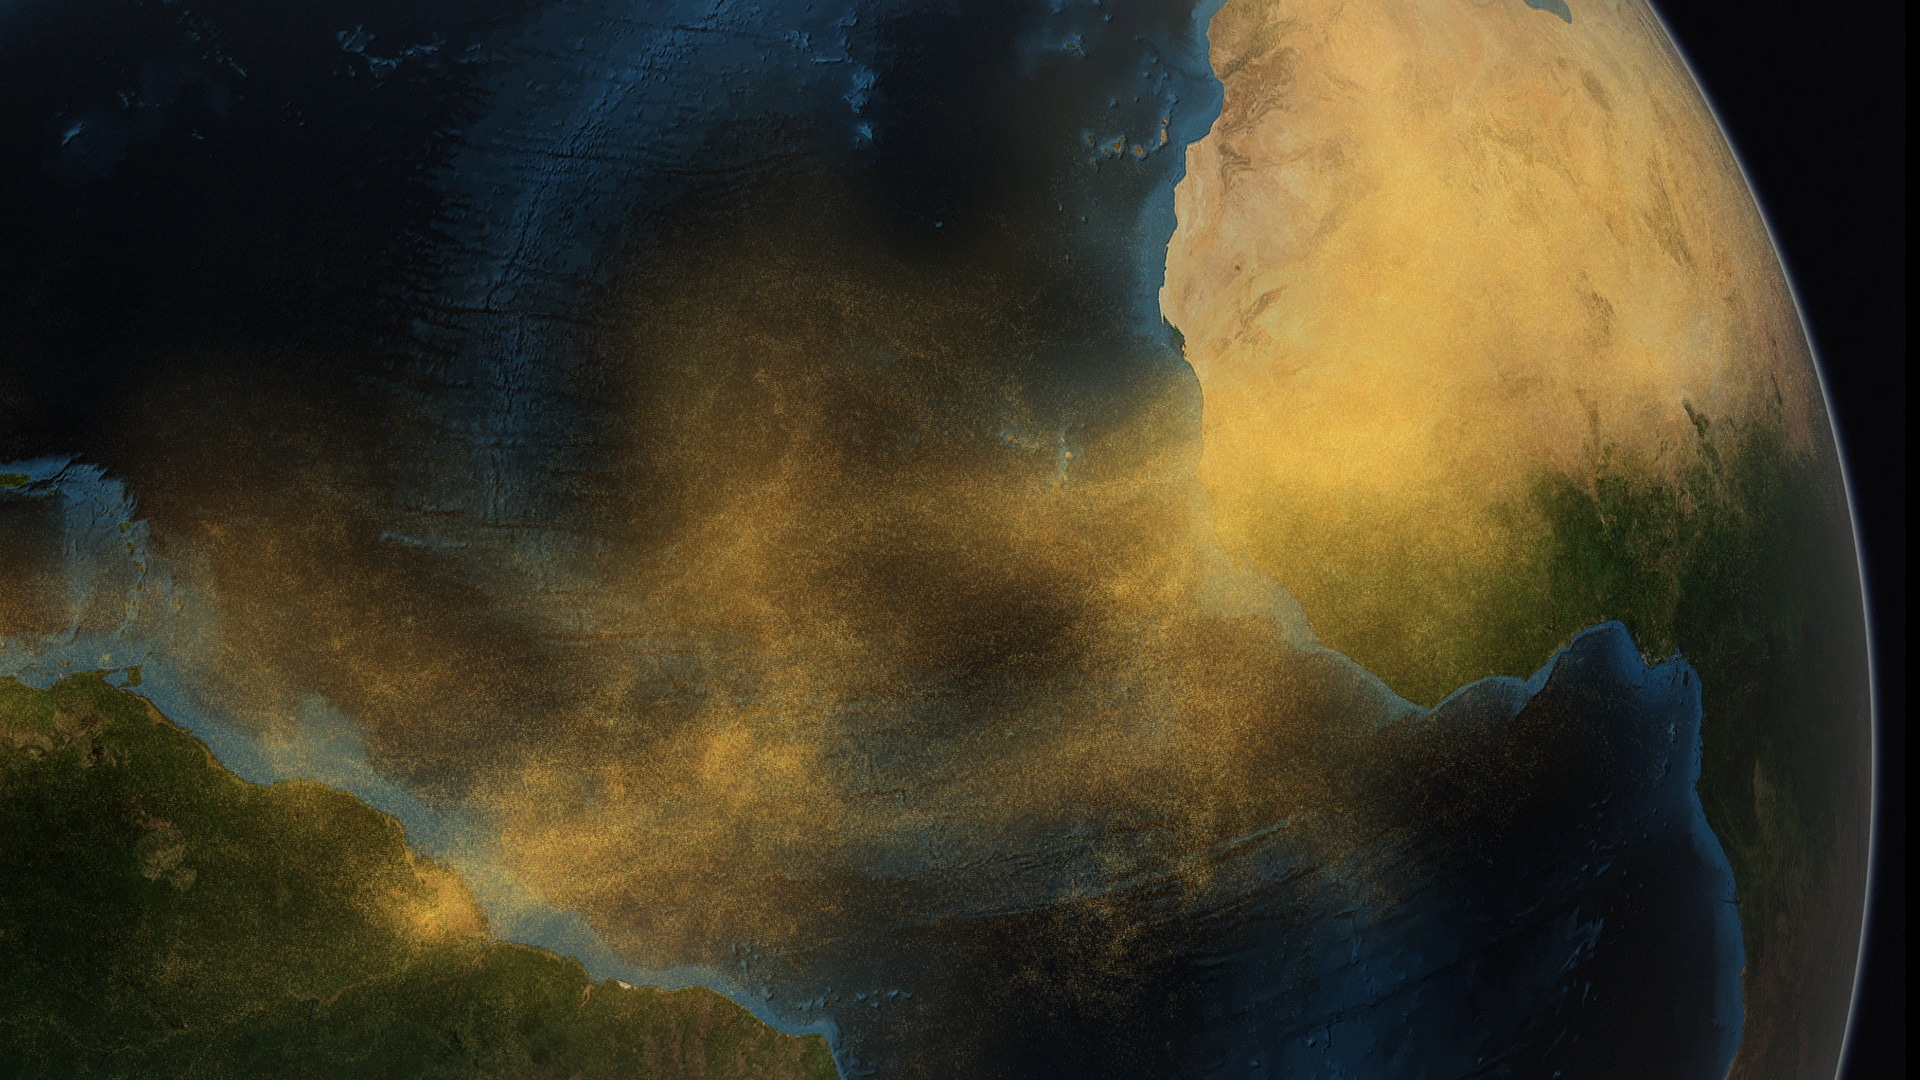
Particle extinction-to-backscatter ratio (lidar ratio) is a key parameter for a correct interpretation of elastic lidar measurements. Of particular importance is the determination of the lidar ratio of the Saharan Air Layer mineral dust transported into the free troposphere over the North Atlantic region. The location of the two sun photometer stations managed by the IzaƱa Atmospheric Research Centre (IARC) on the island of Tenerife and a decade of available micropulse lidar (MPL) data allow us to determine the lidar ratio under almost pure-dust conditions. This result can be considered representative of the Saharan dust transported westward over the North Atlantic in the subtropical belt.

Three different methods have been used to calculate the lidar ratio in this work: (1) using the inversion of sky radiance measurements from a sunā€“sky photometer installed at the IzaƱa Observatory (2373 m a.s.l.) under free-troposphere conditions; (2) the one-layer method, a joint determination using a micropulse lidar sited at the Santa Cruz de Tenerife sea-level station and photometric information considering one layer of aerosol characterized by a single lidar ratio; and (3) the two-layer method, a joint determination using the micropulse lidar and photometric information considering two layers of aerosol with two different lidar ratios. The one-layer method only uses data from a co-located photometer at Santa Cruz de Tenerife, while the two-layer conceptual approach incorporates photometric information at two heights from the observatories of IzaƱa and Santa Cruz de Tenerife. The almost pure-dust lidar ratio retrieval from the sunā€“sky photometer and from the two-layer method give similar results, with lidar ratios at 523 nm of 49 Ā± 6 and 50 Ā± 11 sr. These values obtained from a decade of data records are coincident with other studies in the literature reporting campaigns in the subtropical North Atlantic region. This result shows that the two-layer method is an improved conceptual approach compared to the single-layer approach, which matches the real lower-troposphere structure well. The two-layer method is able to retrieve reliable lidar ratios and therefore aerosol extinction profiles despite the inherent limitations of the elastic lidar technique.

We found a lack of correlation between lidar ratio and ƅngstrƶm exponent (Ī±), which indicates that the dust lidar ratio can be considered independent of dust size distribution in this region. This finding suggests that dust is, under most atmospheric conditions, the predominant aerosol in the North Atlantic free troposphere, which is in agreement with previous studies conducted at the IzaƱa Observatory.

Citation: BerjĆ³n, A., Barreto, A., HernĆ”ndez, Y., Yela, M., Toledano, C., and Cuevas, E.: A 10-year characterization of the Saharan Air Layer lidar ratio in the subtropical North Atlantic, Atmos. Chem. Phys., 19, 6331-6349, https://doi.org/10.5194/acp-19-6331-2019, 2019.

READ THE ARTICLE

Photo credits: NASA-GSFC

The plume of the Icelandic volcano Bardarbunga pollutes the air in the Nord – Pas de Calais

The plume of the Icelandic volcano Bardarbunga pollutes the air in the Nord – Pas de Calais

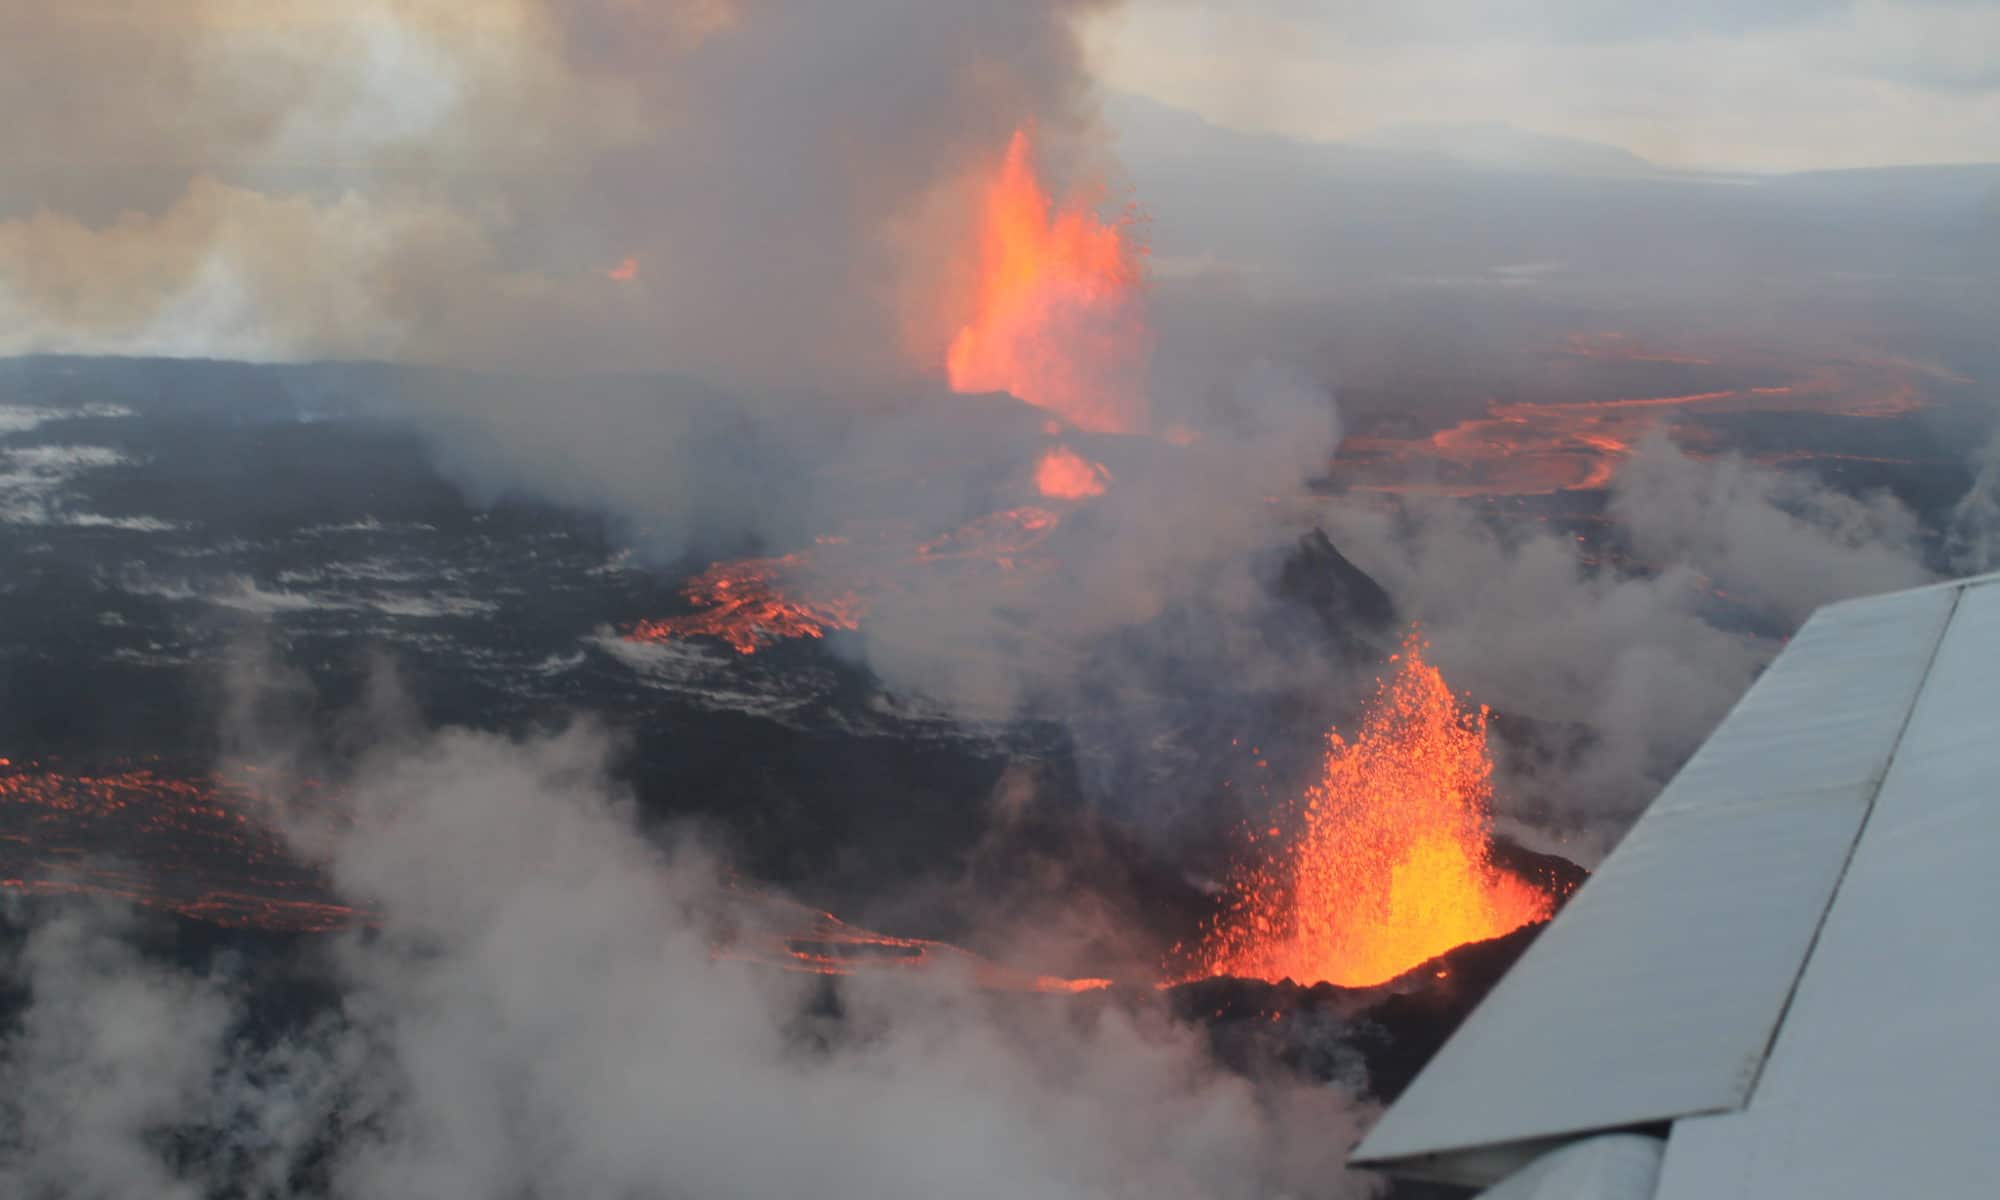
At the end of September 2014, the Nord – Pas de Calais region suffered an episode of heavy air pollution due to the eruption of the Icelandic volcano Bardarbunga, which has already been going on for more than a month.

The analysis of observations of the volcanic plume, obtained from the ground, thanks to CIMEL photometers and LiDAR, and by satellite, by a team of researchers, engineers and technicians from the Laboratoire d’optique atmospheĢrique (LOA, CNRS / UniversiteĢ Lille 1) in collaboration with the association for monitoring air quality atmo Nord – Pas de Calais, allowed them to describe the journey, from Iceland, of the volcanic plume and its arrival in the lowest layers of the French atmosphere.

BSC Dust Daily Forecast ā€“ AAMS platform

CIMEL AAMS SENEGAL

BSC Dust Daily Forecast ā€“ AAMS platform

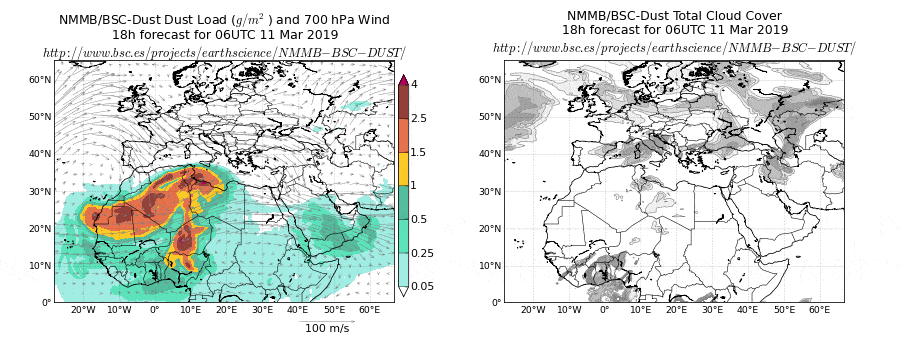
Aerosol particles are important and highly variable components of the terrestrial atmosphere, and they affect both air quality and climate. In order to evaluate their multiple impacts, the most important requirement is to precisely measure their characteristics.

Remote sensing technologies such as lidar (light detection and ranging) and sun/sky photometers are powerful tools for determining aerosol optical and microphysical properties. In our work, we applied several methods to joint or separate lidar and sun/sky-photometer data to retrieve aerosol properties. The Raman technique and inversion with regularization use only lidar data. The LIRIC (LIdar-Radiometer Inversion Code) and recently developed GARRLiC (Generalized Aerosol Retrieval from Radiometer and Lidar Combined data) inversion methods use joint lidar and sun/sky-photometer data.

Link to the article: click here

Mobile Automatic Aerosol Monitoring Solution project (M-AAMS)

Mobile Automatic Aerosol Monitoring Solution project (M-AAMS)

Mobile Automatic Aerosol Monitoring Solution project (M-AAMS)

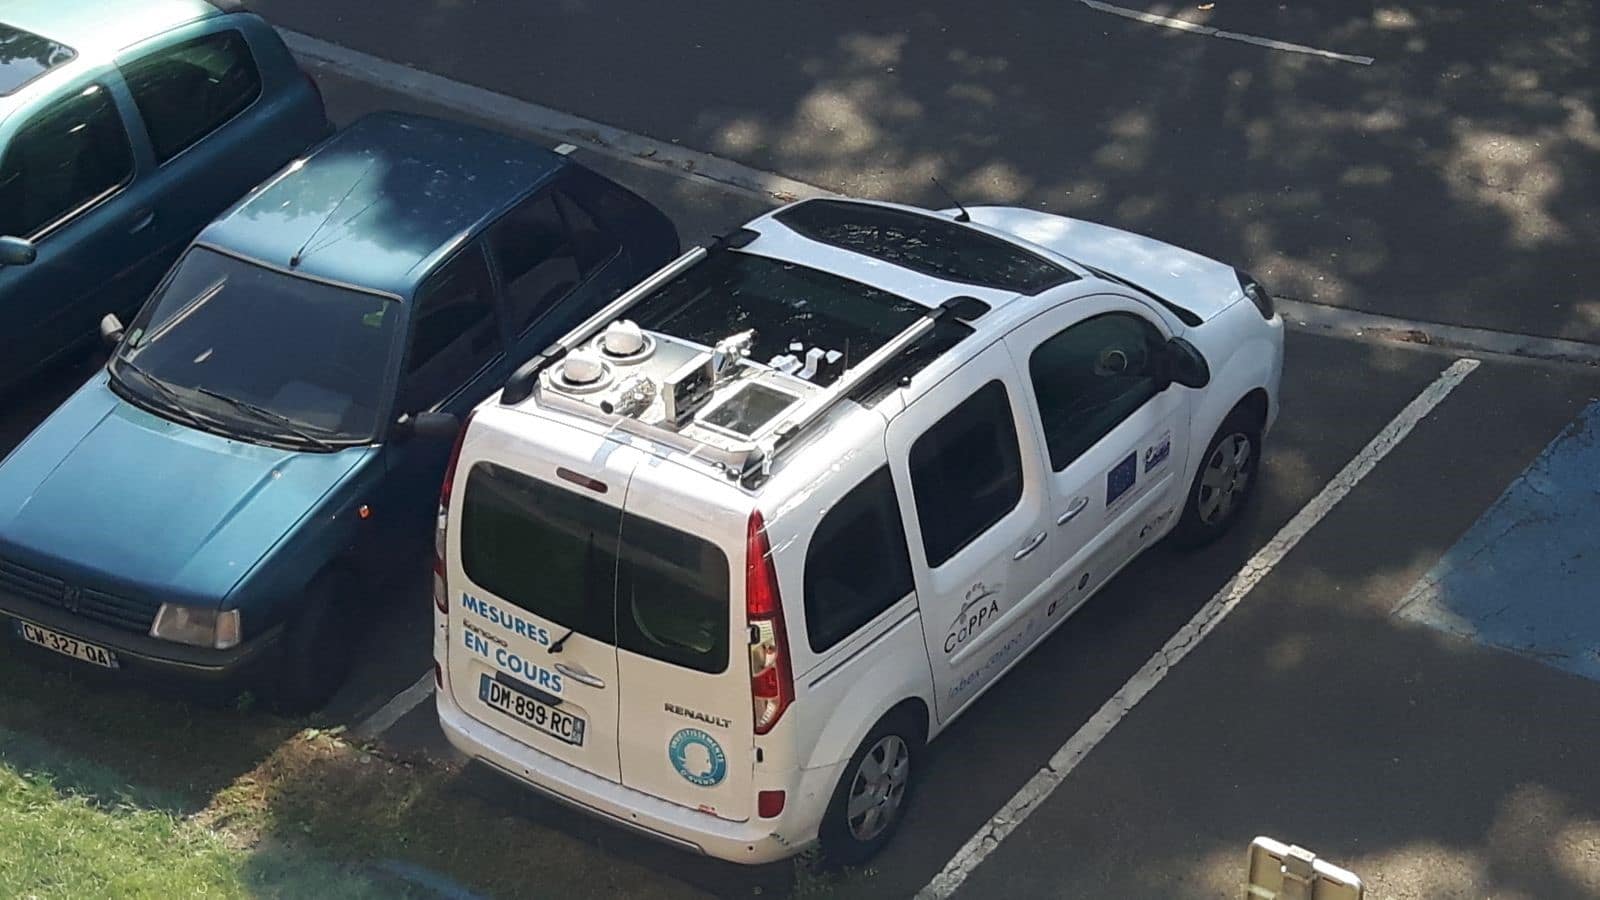
The team of scientists left Lille on Monday morning, direction the Ā« Observatoire de Haute Provence Ā» located in Aix-en-Provence.

Along its trip, the car takes continuous measurements of the atmosphere.

Scientists on board follow them and make sure that all the instruments work properly. The car is not only equipped with a wide range of instruments, but also with a camera and an internet connexion: all needed to document the trip of the car in real time!

Follow the adventure of the #CaPPA_Mobile on twitter.

If the system has already been used locally, this time the route extends from Lille to Aix-en-Provence, nearly 1000 km. This experience is part of Ioana Popovici’s thesis work: “Measurement of aerosol variability at high spatial and temporal resolution, in connection with air quality, using an innovative mobile system. Ā»

This time, the vehicle is equipped with a Cimel CE370 LiDAR (532 nm), the mobile PLASMA photometer (340-1600 nm), a granulometer (GRIMM) and a weather station.

The data collected by the mobile system is being analysed and validated. An inter-comparison of the data will be made with the data collected by the fixed measurement stations of the Haute Provence Observatory and the ATMO stations located along the route. Access to online data of the instrumented car.

The science team relied on good weather to collect as much data as possible. Although the sky cleared several times, clear, cloudless sky conditions were not frequently encountered. Under these circumstances it is difficult to carry out solar photometry measurements and to obtain additional information by combining LIDAR with a solar photometer. However, LIDAR has observed the vertical and spatial variability of the atmosphere. The observation was limited to about 2-3 km altitude by the presence of clouds over most of the trip.

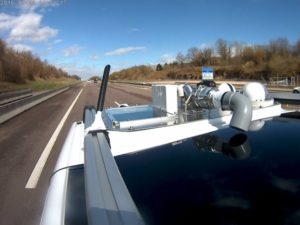
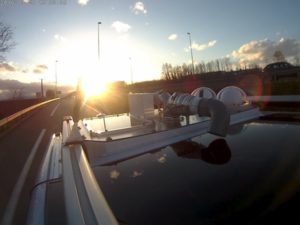
A camera fixed on the roof of the car “confirms” the LIDAR measurements, as follows:

Spatio-temporal series LIDAR obtained between Lille and Valence on 28/03/2016